
Buying a rental property because you liked the neighborhood once, or because your uncle swears by it, is a great way to lose money slowly. The investors who actually make it work these days lean hard on data. Population shifts, rent growth numbers, vacancy rates, job stats. Boring stuff, maybe, but it’s what keeps you from overpaying in some overhyped market that’s already peaked. Use it right and you find the markets with real, durable upside instead of the ones everybody’s already crowded into.
So this is a walk through what data actually matters, where to dig it up, how to read rent growth and vacancy trends without fooling yourself, and how to blend all those numbers with the kind of street-level stuff a spreadsheet will never tell you.
Table of Contents
- What Is Real Estate Market Data, and Why Does It Matter?
- How Do Investors Find Profitable Rental Markets?
- Which Real Estate Market Data Sources Should Investors Trust?
- How to Analyze Rent Growth Data Like a Professional Investor
- Vacancy Rates: The Hidden Signal Most Investors Miss
- Combining Real Estate Market Data With On-the-Ground Research
- Common Mistakes Investors Make When Reading Market Data
- Frequently Asked Questions
What Is Real Estate Market Data, and Why Does It Matter?
Real estate market data is just the collection of numbers that describe the health and direction of a housing market: home prices, rent levels, vacancy rates, population growth, job creation, inventory. That’s it. The point of tracking it is so you can compare cities and neighborhoods honestly, instead of judging a place off one afternoon visit and a gut feeling.
Why bother? Because real estate is a slow, expensive, long-haul commitment, and markets can transform completely over the five or ten years you’re holding a property. A city that looks like a rocket ship in 2024, all job growth and rising rents, might have been sleepy and forgettable back in 2015. The U.S. Census Bureau’s Population Estimates Program has shown Sun Belt metros like Austin, Raleigh, and Tampa sitting near the top of the fastest-growing regions in the country for a solid decade now, and that growth tracks almost perfectly with rental demand and rent appreciation in those same markets. Investors who catch that kind of trend early tend to buy before prices catch up to the fundamentals. That’s where the money is.
Without the data, you’re guessing. With it, you can actually rank markets by growth potential, run realistic rent-to-price math, and make a reasonable bet on which neighborhoods hold up through the next economic cycle. It won’t make you psychic. But it beats a coin flip.
How Do Investors Find Profitable Rental Markets?
The short answer: they stack several data points on top of each other to find cities where demand for housing is outrunning supply. No single number does the job. It’s the overlap that tells you something.
Population and Job Growth
Population growth is usually the first filter, and for good reason. More people moving in means more renters and buyers fighting over a limited number of homes. The Bureau of Labor Statistics puts out monthly employment data by metro, and a lot of investors line that up against net migration numbers from the annual reports moving companies release (yes, the U-Haul and Atlas data is genuinely useful). What you’re hunting for is a market adding jobs faster than it’s adding housing units. That mismatch is what pushes rents up.
Rent Growth Trends
Rent growth trends tell you how fast average rents are climbing, or falling, year over year in a given metro or submarket. You want markets beating the national average, which apartment research firms like RealPage and Yardi Matrix have historically pegged in the 2% to 4% range annually. Some high-demand metros have blown way past that, though. Much of the Sun Belt saw double-digit rent growth in 2021 and 2022 when supply got tight and everybody was moving at once.
Vacancy Rates
Vacancy rates measure the share of rental units sitting empty at any given moment, and honestly, they’re one of the cleanest reads on whether a market is balanced. Below 5% usually means landlords have pricing power. Above 7 to 8% and you’re often looking at oversupply or fading demand. A sudden jump in vacancy is one of my favorite early warning signs, sometimes more telling than price data, because vacancies move before rents do.
If this all sounds a bit much and you’re just getting started, don’t skip the fundamentals for the fancy metro spreadsheets. Our guide, Rental Property Investing 101: A Beginner’s Roadmap, covers evaluating a single property, from financing to cash flow, and it pairs nicely with the bigger-picture market stuff here.
Which Real Estate Market Data Sources Should Investors Trust?
The most reliable data comes from a mix of government agencies, private research firms, and MLS aggregators, because no single source covers everything. Smart investors triangulate across three or four before they put real money down.
Government sources are the backbone. The U.S. Census Bureau, the Bureau of Labor Statistics, and HUD all give you free, methodologically serious data on population, jobs, and housing supply. Private firms like Zillow, Redfin, CoStar, and Yardi Matrix get more granular and closer to real-time on rents and vacancies, often down to the neighborhood, though the good reports usually sit behind a paywall. And your local MLS is where you find the truest picture of what’s actually listed right now, days on market, price per square foot, all of it, ZIP code by ZIP code.
| Data Source | Best For | Update Frequency | Cost |
|---|---|---|---|
| U.S. Census Bureau | Population and migration trends | Annual (some quarterly) | Free |
| Bureau of Labor Statistics | Employment and wage growth | Monthly | Free |
| Zillow Research | Home values, rent index (ZORI) | Monthly | Free |
| Yardi Matrix / CoStar | Vacancy rates, rent growth, new supply pipeline | Monthly/Quarterly | Paid (subscription) |
| Local MLS | Active listings, days on market, pricing | Real-time | Requires agent access |
One thing worth mentioning: the whole “use better data to make better calls” idea isn’t unique to real estate. It’s true across pretty much every asset class. Crypto traders lean on platforms like Cryptocoinsjournal for market analysis and trend coverage before they move. Different market, same principle. Better data, better timing.
How to Analyze Rent Growth Data Like a Professional Investor
The pros analyze rent growth by comparing year-over-year changes across several time frames, not just last quarter, so they can tell real trends apart from random noise. One hot quarter means nothing. A multi-year pattern of steady rent gains, backed up by job and population growth? That’s a signal.
Start by pulling five years of rent growth for your target metro, then break it out by property type: single-family, small multifamily, big apartment complexes. These segments genuinely move at different speeds. You’ll sometimes see a metro where the big apartment buildings are flat while single-family rentals in the exact same city are posting 6 to 7% a year, which happens a lot in places where remote work pushed everyone toward houses with yards.
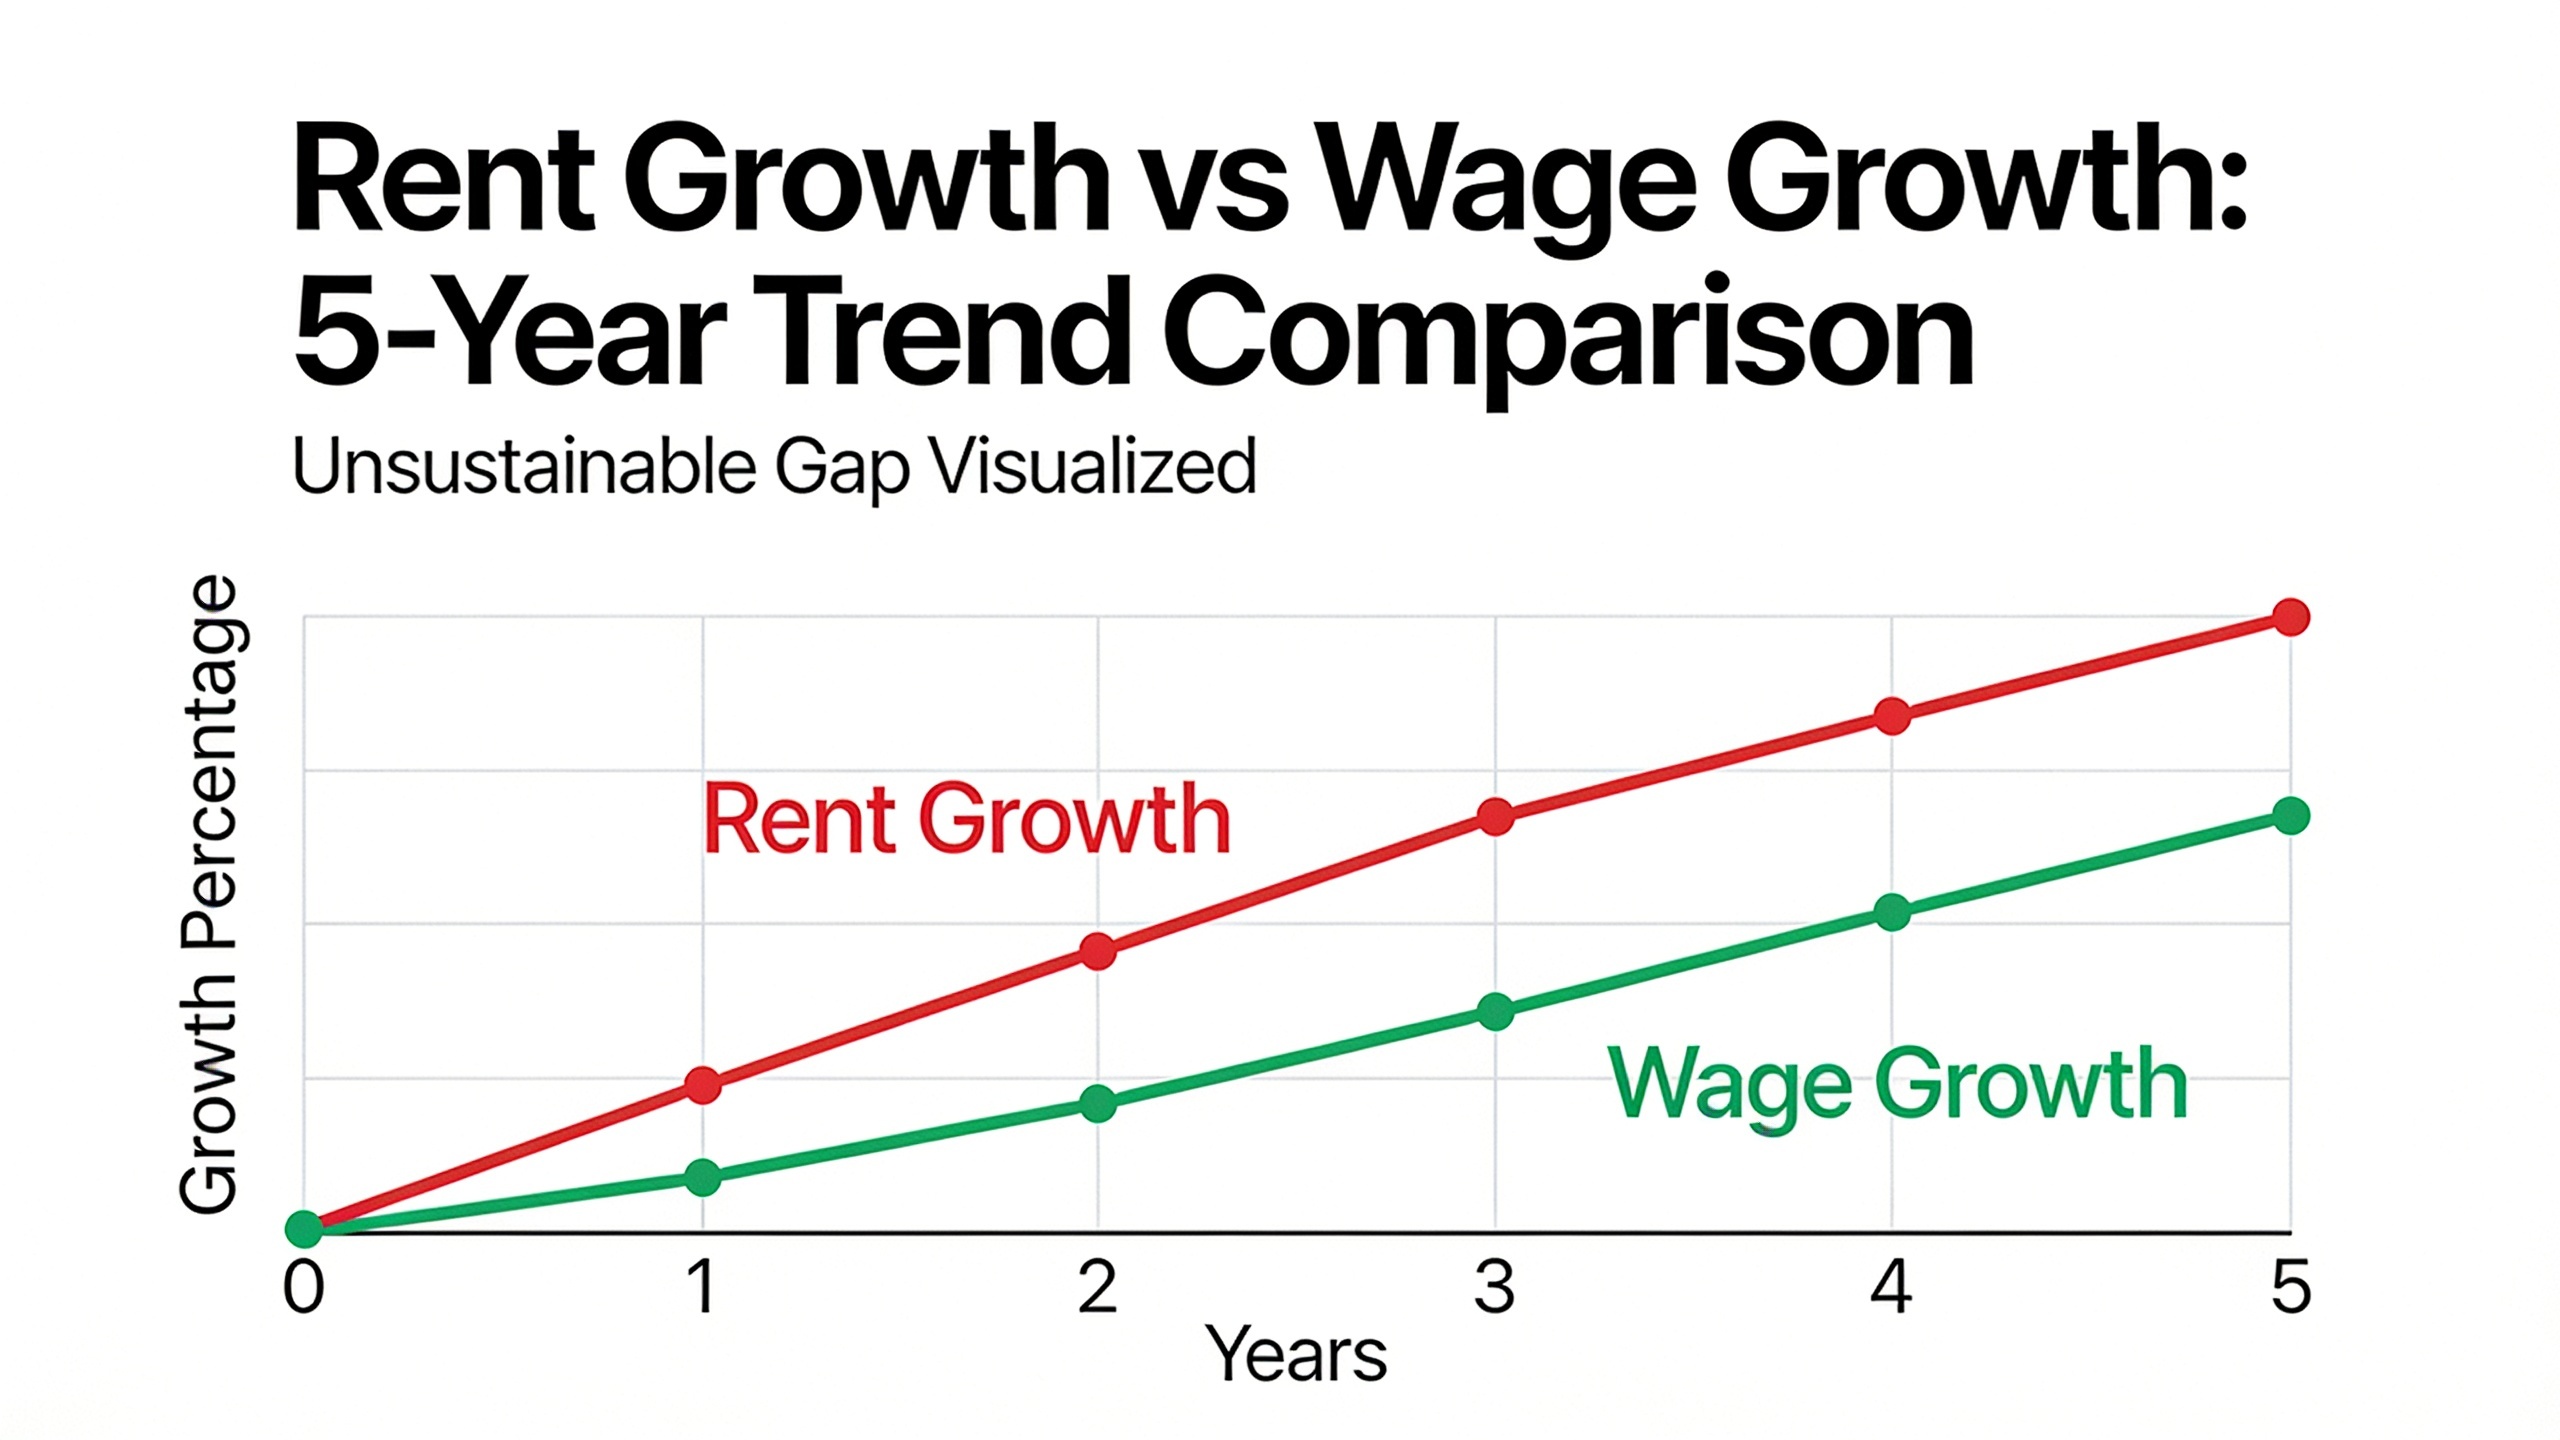
Then compare rent growth to local wage growth. This is the step people skip, and it matters. If rents keep outrunning incomes year after year, the market’s creeping toward an affordability ceiling. Eventually that slows rent growth or shoves renters into smaller units and roommate situations. Investors who ignore this end up overpaying on rent projections that were never sustainable.
Last, look at what’s being built. The new supply pipeline, basically. The Census Bureau’s Building Permits Survey, cross-checked against local planning records, tells you whether a wall of new apartments is about to land and flatten rent growth over the next year or two. Strong rent growth today plus a giant construction pipeline is a very different bet than strong demand with almost nothing new coming online. Treat them differently.
Vacancy Rates: The Hidden Signal Most Investors Miss
Vacancy rates are probably the most underused number in this whole game, which is a shame, because they tend to shift before rent prices do. A vacancy rate is just the percentage of rental units sitting empty at a point in time, reported at the national, metro, and sometimes neighborhood level.
So why the extra attention? Rents lag. Landlords will hold asking rents flat for months even as their units empty out, because nobody wants to advertise weakness. Vacancy, on the other hand, reacts almost instantly. A big employer announces layoffs, or a wave of new construction finishes, and vacancy climbs within a quarter or two. Way before the advertised rents ever budge.
When you’re comparing markets, look at both the current vacancy rate and where it’s been heading. A market at 4% that’s been creeping up from 2% over three years is a completely different animal than one that’s held steady at 4% the whole time, even though the snapshot looks identical. The first one might be sliding toward oversupply. The second is probably just fine.
And segment it by property class while you’re at it. Class A luxury stuff usually carries higher vacancy than older Class B and C properties, simply because shiny new supply leases up slowly. So if you’re targeting workforce housing, weight the Class B/C numbers more than the headline market-wide figure, which a glut of empty luxury towers can totally distort.
Combining Real Estate Market Data With On-the-Ground Research
Data tells you where to look. It doesn’t tell you what to buy. Those are two different things, and the magic happens when you use both. Numbers can point you at a promising ZIP code, but they can’t tell you the block goes sketchy after dark, or that the “good” school just lost half its teachers, or that the road out front is about to become a construction zone for two years.
Once the data trims your list to two or three neighborhoods, go there. Walk the streets at different times of day. Talk to property managers and agents who actually live in that submarket. Safety is the one data really undersells, because crime stats usually get reported at the city or precinct level, which hides a ton of block-to-block variation. Some investors and property managers close that gap by bringing in security firms directly. Providers like Stormhammer Security run patrol and monitoring services for rental portfolios in areas where a little extra security helps keep tenants around and protects the property’s value, which matters more the bigger your multifamily holdings get.

Schools are another one that moves rental demand hard, especially in the suburbs where you’re chasing families. Ratings from GreatSchools or Niche give you a quick benchmark, sure, but the sharper investors dig into district trends, enrollment growth, even what academic support exists locally. Strong school infrastructure, including tutoring and exam-prep options like those from Quiethelpgcse, can genuinely tip a family renter toward one suburb over a near-identical one down the road.
Once you’re actually eyeballing specific properties, how the listing is written starts to matter as much as the market data. Learning how to read property listings like a pro helps you catch the red flags, the wildly optimistic rent projections, the staged photos hiding a wreck. That’s the property-level due diligence that rounds out all the macro stuff.
Tech is speeding all this up too. The same way AI tools like RobinRank now handle huge chunks of content research and analysis over in the SEO world, similar AI platforms are showing up in real estate to scrape, clean, and summarize market data across hundreds of metros in minutes. Work that used to eat up days of an analyst’s time.
Common Mistakes Investors Make When Reading Market Data
The biggest mistake, by far, is leaning on one snapshot number. Current median price, last quarter’s rent growth, whatever. A market that looks great on a single stat can look totally different once you factor in the population trend, the supply pipeline, and the vacancy history. Always pull the trend, always cross-reference.
Second one: confusing appreciation potential with cash flow potential. These are not the same, and people mix them up constantly. High-growth coastal and Sun Belt metros often deliver strong long-term appreciation but weak day-one cash flow, because prices already baked in that growth. Slower Midwest and Rust Belt markets flip it, better cash flow up front, more modest appreciation. Neither is wrong. You just have to be honest with yourself about which one you’re actually buying for.
Third, and this one drives me nuts, is overweighting national headlines. National rent growth or vacancy figures are averages smeared across dozens of wildly different metros. A headline about “slowing rent growth” can be technically true while a specific submarket inside a booming metro is still cranking out 6% annual increases because nobody built anything new there. The average lies to you. The local number doesn’t.
And finally, people buy and then just… stop looking. Markets aren’t frozen in time. The same rent, vacancy, and employment metrics you used to justify the purchase should get a fresh look every year, to confirm your thesis is still holding up. Don’t assume the analysis you ran three years ago still describes reality today. It probably doesn’t.
Frequently Asked Questions
What’s the single most important market data metric for rental investors?
There really isn’t one, but if you forced me to pick, rent growth combined with vacancy rate trends gives the clearest read on supply and demand. Population and job growth are great leading indicators, but rent growth and vacancy reflect actual tenant demand and pricing power in real time.
How often should I check the data on a city I already invested in?
Once a year at minimum for the key stuff: rent growth, vacancy, local employment. Bump it up to quarterly if you’re eyeing more purchases in that market or thinking about refinancing.
Are free sources like Zillow and Census data actually good enough to invest on?
For macro trends like population growth and general rent indices, yeah, they’re a solid starting point. Where they fall short is neighborhood-level detail, which is where paid platforms like CoStar or Yardi Matrix earn their keep. Most people use the free data to shortlist markets, then pay for detailed reports or MLS access before pulling the trigger.
What vacancy rate counts as healthy?
Below 5% is generally landlord-friendly, meaning demand is outpacing available units. Above 7 to 8% usually points to oversupply or softening demand. That said, context matters, a “healthy” rate shifts by property type and region, so always compare it against that specific market’s own history.
As a first-timer, should I chase high growth or high cash flow?
Depends on your goals and your stomach for risk. High-growth markets give you stronger appreciation but thinner cash flow because prices are already elevated. High-cash-flow markets hand you steadier monthly income with more modest appreciation. Honestly, a lot of first-timers start cash-flow-focused to build a cushion, then reach for the higher-growth, higher-price plays once they’ve got some breathing room.
—
Picking a profitable rental market really comes down to discipline. Pull your data from a few credible sources, watch rent growth and vacancy over time instead of freezing on one snapshot, and pair the numbers with real local knowledge before you sign anything. Markets will keep moving, people relocate, employers grow and shrink, new supply comes online. But if you build the habit of actually checking the data, consistently, you’ll spot the next good market before the crowd wakes up to it. And that head start is the whole ballgame.
Leave a Reply